Estimates vs reality
During the brainstorming phase for the jscad-mcp-example gallery, Claude sized three demos:
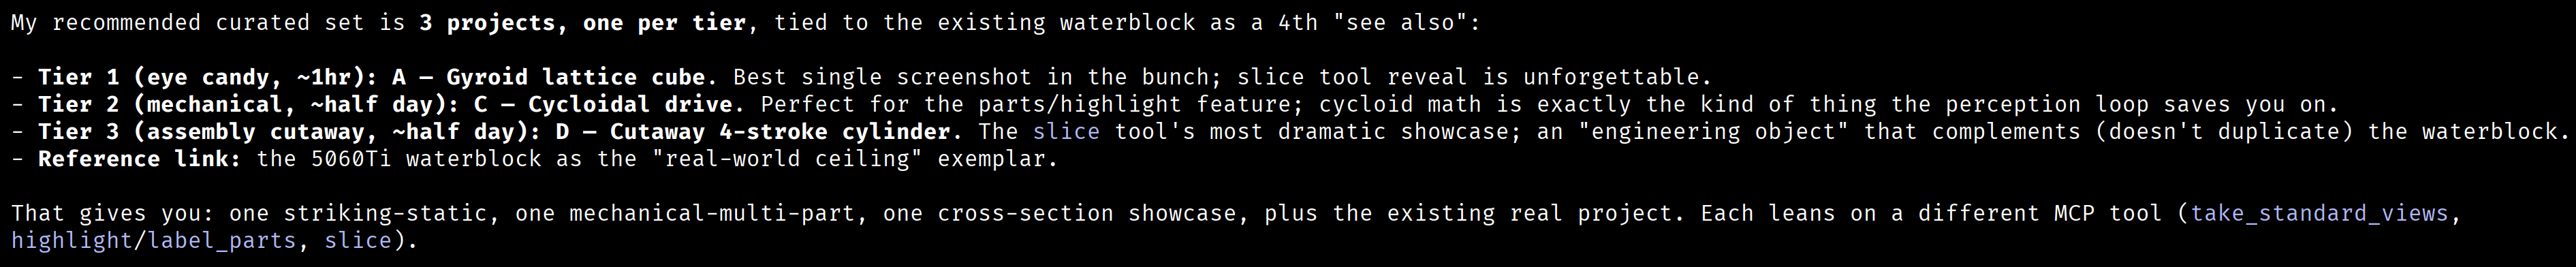
Tier 1 (eye candy, ~1hr): A — Gyroid lattice cube. Tier 2 (mechanical, ~half day): C — Cycloidal drive. Tier 3 (assembly cutaway, ~half day): D — Cutaway 4-stroke engine.
Roughly nine hours of estimated work for the initial three demos.
The original three — Day 1
Section titled “The original three — Day 1”Measured from the first to last commit on the build branch:
| Demo | Estimated | Actual | Notes |
|---|---|---|---|
| Cycloidal drive | ~4 hr | 49 min | Includes the overlapping-holes geometry fix |
| Engine cutaway (v1) | ~4 hr | 24 min | First version: per-part colors and 12-frame crank sweep |
| Gyroid lattice | ~1 hr | 15 min | Includes the marching-cubes |f| → f² iso-function fix |
| Total Day 1 | ~9 hr | ~88 min | ≈ 6× under estimate |
Everything above shipped in one session on day one, alongside the spec, plan, unit tests for the cycloid and marching-cubes math, screenshots, the engine crank-sweep GIF, and two iteration GIFs.
The next ten — Day 2
Section titled “The next ten — Day 2”The next session re-rendered the engine cutaway under stricter inspection (the four-round-engine story), then added ten more demos:
| Work | Wall-clock window | Span |
|---|---|---|
Engine: four iteration rounds (fix(engine) × 4) | 12:37 → 13:46 | ~69 min |
| Seven new demos as a single squash commit (vase, voronoi panel, threaded bolt + nut, gear pair, snap-fit box, caliper, heatsink) | 12:37:42 → 12:38:42 commit | bundled — see note below |
HO-scale water tower + Pratt truss bridge (feat(examples): HO-scale water tower + Pratt truss bridge then portal fix) | 14:20 → 14:28 | ~8 min between commits |
| Image → lithophane + lessons-learned writeup | 14:52 → 15:25 | ~33 min |
The seven-demo bundle is the rough spot in this table: it landed as one squashed commit, so per-demo timing isn’t recoverable from git log alone. The whole cluster of additions on day two — engine fixes, seven new demos, two HO models, and the lithophane — sits inside a ~3-hour active window of intermittent work.
What it adds up to
Section titled “What it adds up to”| Metric | Original brainstorm | Reality so far |
|---|---|---|
| Demos | 3 | 13 |
| Time on the build branch | ~9 hr estimated | ~5 hr active commits across two sessions |
| Implied per-demo pace at brainstorm rate | ~3 hr | ~23 min observed |
Reproduce locally:
git -C ../jscad-mcp-example log --reverse --pretty=format:"%ai %s" \ | grep -E "feat\(engine\)|feat\(cycloidal\)|feat\(gyroid\)|seven new|HO-scale|lithophane|truss"The estimates assumed human-developer pace. The perception loop — Claude writing the geometry, Claude rendering it, Claude seeing what came out and adjusting — turns out to be a major accelerator. That delta gets larger, not smaller, as the gallery grows: each additional demo benefits from infrastructure built for the previous ones (parameter UIs, bundling, screenshot pipeline, render policy).
The story isn’t “Claude is fast.” It’s that the feedback loop is short enough for the model to recover from its own mistakes within a single session — and that recovery, more than initial output speed, is what compresses the timeline.